


Your host says the server is healthy. Your caching plugin is configured. PageSpeed Insights still shows four seconds on mobile, and the only thing that changed recently is that you installed a few plugins. Finding the plugin slowing down WordPress is usually a ten-minute job, but only if you measure rather than guess, and almost every guide on this topic recommends guessing.
The short answer: a plugin can slow WordPress down in three places, and each requires a different tool. Slow server response means the plugin is running expensive PHP or database queries, which Query Monitor will show you grouped by plugin. Slow rendering means the plugin is shipping JavaScript and CSS, which Chrome DevTools will attribute to a file path containing the plugin’s folder name. Slow for no visible reason means the plugin is running background jobs on WP Cron. Check the layers in that order, and the culprit is usually obvious before you deactivate anything.
TL;DR
- Deactivating plugins one at a time is the slowest and riskiest diagnostic method. Measure first, deactivate only to confirm.
- Install Query Monitor, load your slowest page while logged in as admin, and open Queries by Component. Plugins are ranked by database time, in milliseconds, with no guesswork.
- For front-end problems, DevTools shows the file path of every script. The plugin’s folder name is in the path.
- The number of active plugins is close to irrelevant. Sixty lightweight plugins routinely outperform eight heavy ones.
- Deleting a plugin does not delete its data. Autoloaded options, custom tables, and orphaned metadata stay behind and keep costing you time on every page load.
Is it really a plugin, or is it your host?
Check this first, because a slow host makes every plugin look guilty. Load your site in a private browsing window with a query string appended, for example ?nocache=1, so the page bypasses the cache, then look at Time To First Byte in DevTools under the Network tab.
Uncached TTFB below 400ms means the server is doing its job and your problem is almost certainly front-end or plugin PHP. An uncached TTFB above 800ms means WordPress is spending real time thinking before it responds, and the cause is either the host, the PHP version, or a plugin running heavy work on every request. That last case is the interesting one, and the next section separates it out.
One clarification worth making, because it trips people up constantly: a cached page can be fast while your site is slow. Caching hides the problem from anonymous visitors and from your own spot checks. Logged-in users, WooCommerce cart and checkout pages, and anything with a nonce bypass the cache entirely, which is why store owners often report a fast homepage and a store that feels broken.
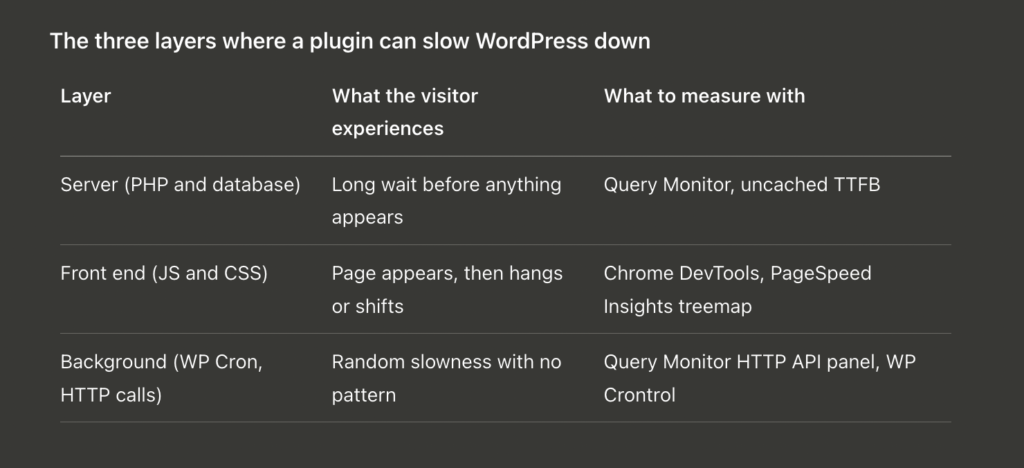
Most plugin problems live in the first layer. Most guides only address the second, which is why so many people optimize images and see no change.
How to find the plugin slowing down WordPress, step by step
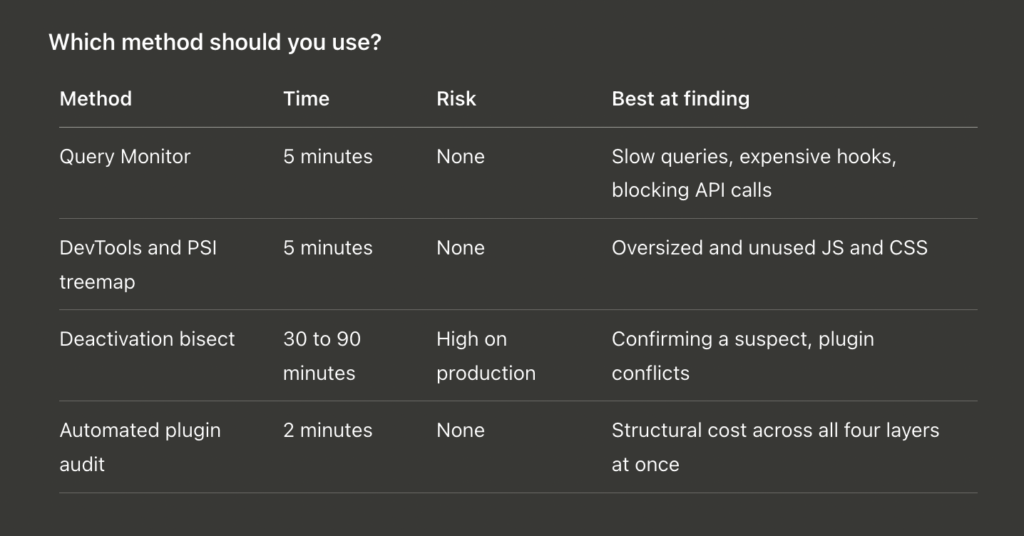
Work through these in order. Steps 1 to 3 take about ten minutes and identify the culprit in most cases. Step 4 is what you do when the answer is not obvious, or the site is too complex to bisect safely.
Step 1. Install Query Monitor and read Queries by Component.
Query Monitor is free, from the WordPress.org repository, and is the single most useful diagnostic tool available for WordPress. Install it, load your slowest page while logged in as an administrator, and open the admin bar panel that appears.
The Queries by Component view groups database queries by the plugin that fired them, with times in milliseconds. A healthy page runs 30 to 80 queries in under 100ms total. If one plugin is responsible for 300 queries or 400ms of database time, you have your answer in under a minute.
Also check the Hooks and Actions panel for callbacks attached to init and wp_loadedsince those run on every request and the HTTP API Calls panel. An external API call made during page generation blocks the response for as long as the remote server takes. A plugin phoning home to a license server on every page load is a classic cause of unpredictable slowness.
The one caveat: Query Monitor measures the request you are making, as a logged-in admin. That is not identical to an anonymous visitor’s request. Use it to find the heavy component, then confirm the effect on an anonymous page load.
Step 2. Attribute the front-end weight.
Open DevTools, go to the Network tab, filter to JS, sort by size, and read the file paths. Anything served from /wp-content/plugins/[name]/ tells you exactly which plugin shipped it. Run PageSpeed Insights on the same URL and open the JavaScript treemap in the diagnostics section, which shows how much of each file went unused.
A plugin loading 200KB of JavaScript on every page for a feature used on one page is the most common front-end finding, and the fix is a conditional dequeue rather than removing the plugin.
Step 3. Bisect properly, if you still need to.
If the measurement has not settled it, deactivation testing remains valid. Do it correctly:
- Work on a staging copy, never on production. Deactivating a plugin on a live site can drop functionality, break layouts, and, in some cases, trigger data cleanup.
- Deactivate half your plugins at once, not one at a time. With 32 plugins, binary search finds the culprit in five tests. One at a time takes up to 32.
- Record an actual number between each test, uncached TTFB or a Query Monitor total. “Feels faster” is not data.
- Re-test with the suspect reactivated to confirm the effect reverses. Plenty of apparent culprits turn out to be coincidence.
Step 4. Use a plugin-level audit when bisecting is impractical.
On sites where deactivating anything is unacceptable, or where the slow component only appears under real traffic, a read-only audit is the practical option. A plugin-level performance audit maps hook execution times, query costs, enqueued assets, and cron behavior back to the plugin that owns each. It does so without deactivating anything.
The honest limitation of any automated audit, this one included: it measures the request it runs, so it catches structural problems (a plugin adding 480ms of hook time, autoload bloat, a cron job running every minute), but it cannot see what your visitors on mid-range phones are experiencing. Field data from the Chrome User Experience Report remains the source of truth for what real users experience.
Which plugin types cause the most slowdown?
Ranked by how often they turn up as the primary cause:
- Page builders. Elementor, Divi, and WPBakery load their full runtime on every page by default, whether or not the page uses their widgets.
- Related posts plugins. Many run an unindexed query across
wp_postsandwp_postmetaon every single post view. This is the highest ratio of damage to visible benefit on this list. - Security plugins with live scanning. Firewall logging writes to the database on every request, including bot traffic, which quietly multiplies your write load.
- Sliders and galleries. Heavy JavaScript libraries loading site-wide for one slider on the homepage.
- Backup plugins on WP Cron. WordPress cron is not a real scheduler; it fires on page visits. A backup triggered by an unlucky visitor’s request runs while that request is being handled.
- WooCommerce extensions. Each one adds hooks to cart and checkout, none of which are cacheable. Stores with fifteen extensions frequently see two-second cart pages.
- “All in one” suites. Loading a full analytics, SEO, and social framework to use one feature from it.
Does the number of plugins matter?
No, and this is the most persistent myth in WordPress performance. What costs time is what each plugin does per request, not how many are installed. A site with 60 plugins that mostly register small filters can outperform a site with 8 plugins where one runs an uncached remote API call on every page load.
Deactivating plugins to reduce the count is therefore not an optimization strategy; it is a diagnostic step. Judge each plugin by its measured cost, and keep the ones that earn it.
What to do once you have found the culprit
Deleting it is the last option, not the first. In order:
- Check the plugin’s own settings. Related posts plugins usually have a caching option that is off by default. Security plugins usually let you exclude bot traffic from logging.
- Load it conditionally. Dequeue the slider script everywhere except the templates that use it. This is a few lines in your child theme’s
functions.phpand often recovers most of the cost while keeping the feature. - Move the work off the request. Anything that does not need to happen while the visitor waits belongs in a background job. Action Scheduler handles this properly, unlike WP Cron.
- Replace it. Most heavy plugins have a lighter equivalent. Check the alternative’s own query count before you commit, since a smaller install size means nothing.
- Then delete, and clean up after it. Uninstalling does not remove the plugin’s data. Autoloaded options, custom tables, and orphaned post meta remain in the database and continue to load on every request. This is why sites get slower over years of plugin churn even as the active plugin count stays flat.
Is ten minutes of this worth it?
The clearest number available comes from Google and Deloitte’s 2020 study across 37 brands and 30 million mobile sessions: a 0.1 second improvement in mobile site speed was associated with retail conversions 8.4% higher and average order value 9.2% higher. That is one tenth of a second. A single heavy related-posts query commonly costs three to five times that.
The ranking argument is weaker and worth stating honestly. Core Web Vitals act as a tie-breaker between pages of similar relevance rather than as a primary ranking factor. Fixing a slow plugin will not rescue thin content. It will prevent good content from being held back and measurably change what visitors do once they arrive.
What to do next
Install Query Monitor, load your slowest page, and open Queries by Component. That single view resolves most cases, and it costs nothing but five minutes.
If the panel shows the cost spread across a dozen components with no obvious offender, or the site is too business-critical to bisect, a free performance audit will map hook time, query cost, and autoload bloat back to individual plugins without installing anything or writing to your database.
wpXplore is published by BetterDots.
5. FAQ section
Q1. How do I know if a plugin is slowing down my WordPress site?
Install Query Monitor, load your slowest page while logged in as an administrator, and then open the Queries by Component panel. It lists every plugin, along with the number of database queries it ran and the time it took (in milliseconds). Any plugin accounting for more than about 100ms of database time on a normal page view is worth investigating.
Q2. How many plugins is too many for WordPress?
There is no meaningful limit, because what matters is what each plugin does on every request, not how many are installed. A site with 60 lightweight plugins can be faster than one with 8 heavy plugins. Judge plugins by their measured cost in Query Monitor rather than by the total count.
Q3. Should I deactivate plugins one by one to find the slow one?
Only on a staging site, and only after measurement has failed to identify a suspect. Deactivating half the plugins at once and narrowing down finds the culprit in about five tests instead of thirty. On a live site, deactivation can break layouts and, in some cases, trigger cleanup routines that delete settings.
Q4. Does deleting a plugin remove everything it added?
No. Most plugins leave behind autoloaded options in wp_options, custom database tables, and orphaned post metadata when uninstalled. This leftover data still loads on every page request, which is why sites accumulate slowness over years of installing and removing plugins.
Q5. Why is my WordPress site slow even with a caching plugin?
Caching only helps anonymous visitors on cacheable pages. Logged-in users, WooCommerce cart and checkout pages, search results, and any page carrying a nonce bypass the cache and hit PHP directly. If a plugin runs an expensive query on every request, caching hides it from your spot checks without fixing it.
Q6. Are page builders like Elementor bad for performance?
Page builders are not inherently slow, but they load their full JavaScript and CSS runtime on every page by default, including pages that use none of their widgets. The measurable fix is conditional loading rather than migration, which usually recovers most of the cost without rebuilding the site.
6. AEO pack
One-line answer
To find the plugin slowing down WordPress, install Query Monitor and open Queries by Component on your slowest page, which ranks every plugin by the number of database queries it ran and the milliseconds it consumed, then confirm the suspect by deactivating it on a staging copy.Questions this post answers
How do I find which plugin is slowing down my WordPress site?
How many plugins are too many for WordPress?
Should I deactivate plugins one by one to find a slow one?
Does deleting a plugin remove its data?
Why is my site slow even with caching enabled?
Which WordPress plugin types cause the most slowdown?





Leave a Comment